Alphabetical Index
Browse by Elements
Keyword Search
Dry Etchants
Dry and Wet Etchants
Wet Etchants
Bulk Etchants
Layer Etchants
Nano Etchants
Single Crystal Etchants
Thin Film Etchants
Thin Foil Etchants
Wafer Etchants
Al Etchants
Cd Etchants
Ga Etchants
Ge Etchants
In Etchants
New Etchants
Other Etchants
Si Etchants
Zn Etchants
Help
Home
Macro-Bubbles and Fiber-Like Inclusions in YCa4O(BO3)3 (YCOB) Crystals
Material Name: YCa4O(BO3)3 (YCOB)
Record No.: 6
Primary Chemical Element in Material: Y
Sample Type: Single crystal
Uses: Growth
Etchant Name: None
Etching Method: No data
Etchant (Electrolyte) Composition: No data
Procedure (Condition): No data
Note: YCa4O(BO3)3 (YCOB) is an important nonlinear optical crystal, which is a key optical element in the
SHG and OPCPA process to obtain high repetition rate, multi-petawatt laser pulse. In this work, we
have grown 5 inch YCOB crystals by Czochralski method and investigated phase separation, defects,
as well as their formation mechanism. Laser induced damage threshold (LiDT), rocking curve and
transmission spectrum is characterized using the sample without defects. It is believed that, based on
this work, large-sized YCOB crystal without defects will be obtained in the near future.
It is generally known that keeping the interface flat (or tiny convex) during crystal growth is
important to eliminate some defects. So, crystal rotation rate should be adapted to control the interface
shape. However, it is difficult to achieve flat interface by adjusting rotation rate since YCOB is
colorless especially during the growth of large-sized YCOB crystal. We successfully achieved a stable
tiny convex interface by varied the rotation rate from 5 to 15 rpm during the growth of 4 inch YCOB
crystal. However, it cannot be achieved any more during the growth of 5 inch YCOB crystal.
That’s why two types of defects were observed in almost all 5 inch crystals.
Bubbles: One of the most common defects is bubble. There are two types of bubbles in YCOB crystals. One is macro-bubble with the size of 0.5-5 mm as shown in Fig. 4. Macro-bubble always appears in the shoulder part of the crystal and close to surface. The other type is micro-bubble with the size of 10-100 µm as shown in Fig. 5. Micro-bubble always appears in the full diameter and bottom part of the crystal and locates inside the crystal, and sometimes accompanies other defects. As in borate crystals, gas easily dissolved in YCOB melt because of its relatively high melt viscosity. It is suggested that bubbles in the melt would move toward surface driven by the buoyancy or liquid
flow. Some bubbles near the interface will arrive at the interface foremost. Then these bubbles will
continue moving along with the interface. Therefore, lots of micro-bubbles gathered near the junction
point (melt, crystal and atmosphere) will turn into a macro-bubble and appear on the surface of the
crystal if the interface is convex, otherwise will be located inside the crystal if the interface is flat or
concave. It is known to all that the interface is always convex during the shoulder process, and will
transfer into flat in full diameter and bottom part if the rotation rate is proper. That is why
macro-bubbles always appear in the shoulder part and close to the surface, while micro-bubbles mainly
locate in the full diameter part and inside the crystal.
Bubbles in melt must be excluded at the cooling process during which the melts turn into solid. The
solidification will start from the center part and towards the crucible wall gradually as the crucible was
the heater. The excluding of the bubbles at the corner of the melt and crucible could be observed during
the cooling process if the cooling rate was less than 30 K/h. On the contrary, the bubbles will be
enclosed in the melt if the cooling rate is very large since the melt surface will turn into solid quickly
and hinder the exhausting of the bubbles. The residual after cooling process will be pushed up by the
bubbles as shown in Fig. 6 under extreme conditions.
Fiber-like inclusions: Fiber-like inclusions often formed at the bottom of the crystal as shown in Fig. 7. These inclusions
with the size of 50 ìm-300 µm in diameter, and 1 mm-30 mm in length appeared approximately
parallel to the c-aixs with few exceptions. The formation of the inclusions showed independence on the
growth velocities. Among these fiber-like inclusions, bubbles and point-like inclusions also existed.
The inclusions are black in color (Fig. 7 (B)) under the optical microscopic. Polished samples coated
with gold which were cut approximately perpendicular to the c-axis were used for SEM observation
and EDX analysis. Fig. 8 displayed that the mass fraction of each element in inclusions was almost the
same with that in background region. Therefore, it could be inferred that there weren’t any impurities
with different composition in the fiber-like inclusions. However, the as-measured content of Y element
was about 10%, larger than theoretical value which was might be caused by the system error of
semi-quantitative EDS method. The exact compositions of the inclusion must be further investigated.
Three issues should be responsible for these inclusions, which have been discussed in detail in
previous work [13, 22]. As far as we are concerned, crystal structure may lead to fiber-like inclusions
parallel to c-axis. As shown in Fig. 9, the Y3+ coordination sphere can be seen as a slightly distorted
octahedral, forming edge-connected chains along the c-axis. Along the axis a and b, there is a corner
present at the interface between every [YO6], [CaO6] octahedral and every [BO3] triangle. According to
the rule of growth habit, the growth rate along axis a and b is faster than that along axis c. In
general, these edge-connected directions possess relatively lower growth rate than those
corner-connected directions. Therefore, liquid phase will be included into crystal before they were
crystallized sufficiently if the actual crystal growth rate is larger than the growth rate of c-axis. In
other words, the largest crystal growth rate was determined by the growth rate of c-axis.
Reference: Xiaoniu Tu, Sheng Wang, Kainan Xiong, Yanqing Zheng, Erwei Shi, Research on growth and defects of 5 inch YCOB single crystal, Journal of Crystal Growth (2018),
doi: https://doi.org/10.1016/j.jcrysgro.2018.02.012.
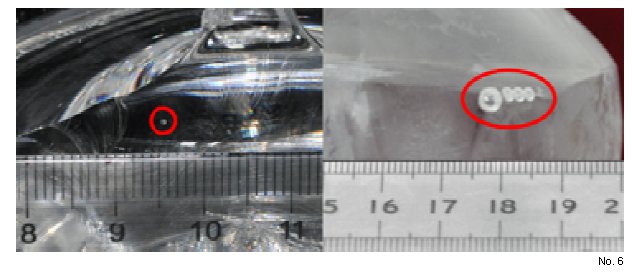
Figure 4: The digital photo of macro-bubbles in the shoulder part of YCOB crystals.
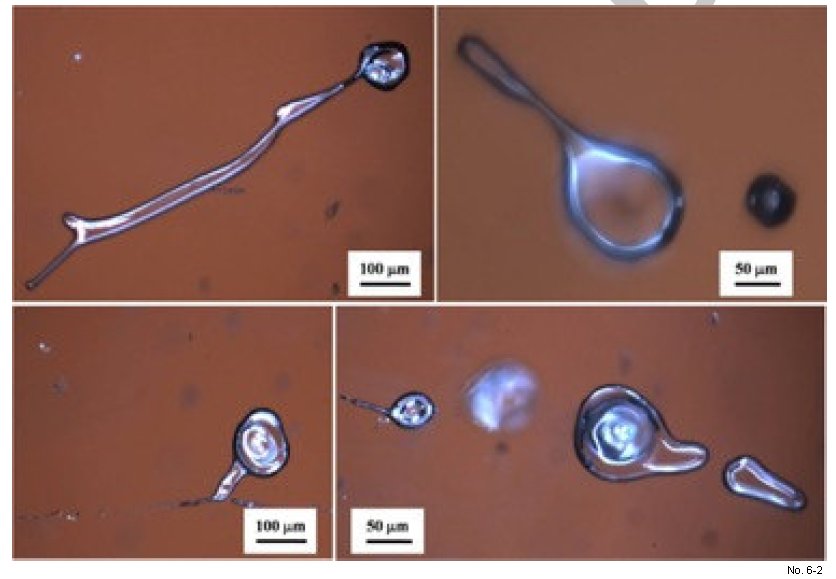
Figure 5: Optical microscopic photos of micro-bubbles inside the YCOB crystals.

Figure 6: The rest of solid after growth which was pushed up by the bubbles.
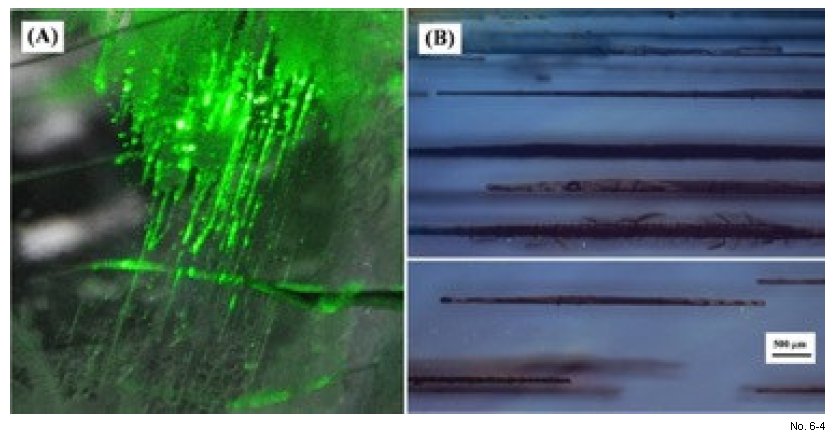
Figure 7: Fiber-like inclusions in YCOB crystals, (A) digital photo illuminated with a green laser; (B)
optical microscopic photo.
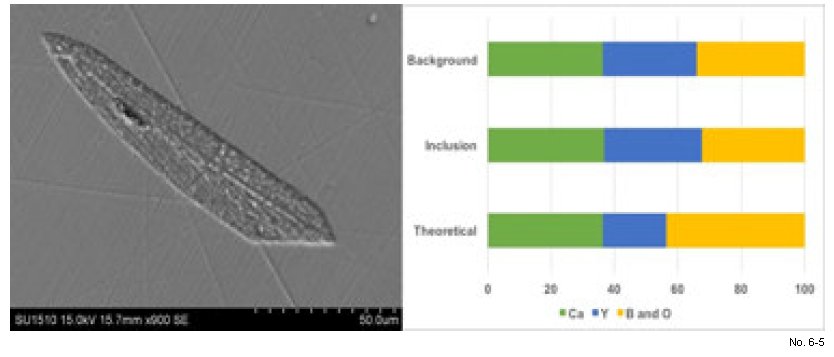
Figure 8: SEM and EDS analysis of fiber-like inclusions.